Tag: cool studies

Let’s sing about “reproductive messages” baby

Apparently nine out of ten top ten songs in 2009 featured “reproductive messages” – which means they were about sex.

“Approximately 92% of the 174 songs that made it into the [Billboard] Top 10 in 2009 contained reproductive messages,” says SUNY Albany psychology professor Dawn R. Hobbs in Evolutionary Psychology. That’s right–“reproductive messages,” our newest favorite euphemism.”

Here’s how those songs were distributed across “reproductive” categories.

If its your thing – you can read the study of those songs here (pdf).

Via The Atlantic.

The economics of football (soccer) substitutions

An economist’s study of the optimal timing of substitutions in football matches (spanning a bunch of 2009/10 leagues) discovered the following:

Dr. Myers analyzed the substitutions and ensuing results of every game played during the 2009-10 season in the top English, Spanish, Italian and German professional leagues, as well as the 2010 Major League Soccer season and the 2010 World Cup. He concluded that if their team is behind, managers should make the first substitution prior to the 58th minute, the second substitution prior to the 73rd minute and the third prior to the 79th minute. Teams that follow these guidelines improve—score at least one goal—roughly 36% of the time. Teams that don’t follow the rule improve about 18.5% of the time. He noted 1,037 instances the rule could have been applied and found that managers abide by it a little less than half the time. He also found that the timing of subs has no effect on the team ahead in the score or if the match is tied.

Via Freakonomics, more at the Wall Street Journal.

Modelling the city: with maths

This is pretty cool, a feature in the New York Times about a guy who has “solved the city” – or rather, come up with mathematical expressions for certain inevitable urban constants.

“After two years of analysis, West and Bettencourt discovered that all of these urban variables could be described by a few exquisitely simple equations. For example, if they know the population of a metropolitan area in a given country, they can estimate, with approximately 85 percent accuracy, its average income and the dimensions of its sewer system. These are the laws, they say, that automatically emerge whenever people “agglomerate,” cramming themselves into apartment buildings and subway cars…

“What we found are the constants that describe every city,” he says. “I can take these laws and make precise predictions about the number of violent crimes and the surface area of roads in a city in Japan with 200,000 people. I don’t know anything about this city or even where it is or its history, but I can tell you all about it. And the reason I can do that is because every city is really the same.”

Charting the social acceptability of peeing in public

This is no laughing matter. It’s serious sociology people. Get with the program.

So, because you all need to think more deeply about your innate desire to pee in public, here’s a graph representing the social acceptability of said action (or other peeing related actions) and the outcomes of such pressure on your bladder. This social pressure creates real pressure.

From the artist/sociologist:

This was something I used to help me think through the two main axes that determine peeing behavior – biological and social control. Urination is a biological function that has been subjected to a great degree of social control. Unfortunately, urban design has not kept pace with the demand for clean, easily accessible public restrooms for humans. And there has been no attempt to create any kind of system to deal with canine urine. In most cities it is illegal for humans to pee in public but both legal and widely accepted for dogs to pee where ever they like (in New York, they cannot pee on the grass in parks).

Game Theory: Understanding the mechanics of Pacman

Well. I’ll never look at a game of Pacman in quite the same way again.

Its mysteries have been revealed by these two links – firstly the Pacman Dossier – basically a textbook on Pacman, and secondly, this study of the mechanics, and individual personalities, of the Pacman ghosts – which draws on material from the first.

The ghosts have three movement patterns, each individually calibrated. These patterns are determined by what mode they’re in – chase, scatter, or frightened. And these modes switch based on time cycles in each level. The modes determine what a ghost will do as it approaches an intersection.

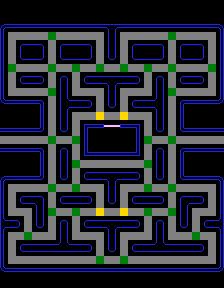
“The diagram above shows a simplified representation of the maze layout. Decisions are only necessary at all when approaching “intersection” tiles, which are indicated in green on the diagram.

When a decision about which direction to turn is necessary, the choice is made based on which tile adjoining the intersection will put the ghost nearest to its target tile, measured in a straight line. The distance from every possibility to the target tile is measured, and whichever tile is closest to the target will be selected.”

Here’s what happens in Scatter mode:


Each ghost has a pre-defined, fixed target tile while in this mode, located just outside the corners of the maze. When Scatter mode begins, each ghost will head towards their “home” corner using their regular path-finding methods. However, since the actual target tiles are inaccessible and the ghosts cannot stop moving or reverse direction, they are forced to continue past the target, but will turn back towards it as soon as possible. This results in each ghost’s path eventually becoming a fixed loop in their corner. If left in Scatter mode, each ghost would remain in its loop indefinitely. In practice, the duration of Scatter mode is always quite short, so the ghosts often do not have time to even reach their corner or complete a circuit of their loop before reverting back to Chase mode.

Uncaught, bear handed

How do you thwart a high-tech security system that analyses your fingerprints. In a school. Because all schools need fingerprint scanners… at least according to a school in New South Wales. You stick gummy bears on your fingers.

Yes. Apparently gummy bears can foil most fingerprint scanners. Exciting, no?

From the scientific study of gummy fingers and biometric security systems:

“We also pointed out that artificial fingers can be made not only of silicone but also of gelatin, and examined 11 types of fingerprint systems whether or not they accept the gummy fingers. Consequently, all of these systems accepted the gummy fingers all in their enrollment procedures and also with the rather higher probability in theirverification procedures. The results are enough for us to see evidence that artificial fingers can be accepted by commercial fingerprint systems. The objection will no doubt be raised that it is very difficult to take an impression of the live finger from a legitimate user without the cooperation of her/him. Therefore, we demonstrated that the gummy fingers made from residual fingerprints can be accepted by all of the 11 systems. “

Angry Birds Plush Toys, not actual size

TechCrunch has a scoop (not uncommon for the leading blog about goings on on the Internet). Everybody’s favourite iPhone game characters, the Angry Birds, are becoming tangible. Check out this range of plush toys headed your way (TechCrunch has photos of all of them).

Now, I can tell you that these birds aren’t actual size because somebody smart at
Wired/a> conducted some mathematical modelling on the game to determine its physics, and as a result, calculated that the red bird is five metres tall.

They worked out that there’s no air resistance in the angry birds world, and thus, gravity is the only force working on the bird (which moves at 2.46 angry birds per second in the horizontal direction).

“The only force acting on the bird (if the bird is not moving too fast) would be the gravitational force from the Earth. This is where I see lots of intro-student mistakes. They tend to want to put some force in the horizontal direction because the bird is moving that way. DON’T do that. That is what Aristotle would have you believe, but you don’t want to be in his club. There is no horizontal force in this case – no air resistance.

Check out the maths at Wired to see how the calculation of the bird’s height (actually 4.9m) was made.

The fastest path between four points: Math and Baseball

No, I’m not exploring my creative side by doing one of those drawings where you get those little coloured plastic cogs, and a pen, and swirl them around a page. That diagram is the result of careful mathematical study of the geometry of baseball, it represents the fastest path around all four bases – useful only if you hit a deep ball that doesn’t go over the fence and you want to run home – it’ll shave milliseconds off your time.

If you are running to first, or between first and second (or second and third, or third and home), which I believe in baseball parlance is a single (what would I know, I’m from Australia, we play cricket) the straight line is no doubt still the best bet. This circuitous route shaves about 25% off the time taken for the run – because turning sharp angles slows runners down substantially.

Some quotes from the story:

The issue is that turns slow runners down. The tighter the turn, the greater the slowdown, so while the straight-line path between the bases is the shortest, its sharp corners make it one of the slowest. Rounding the corner is faster, making the path a bit longer in favor of an efficient turn. And indeed, baseball players typically do this: They run straight along the baseline at the beginning and then, if they think they’ve hit a double or more, they bow out to make a “banana curve.”

But this can’t possibly be the quickest route, observes Davide Carozza, a math teacher at St. Albans School in Washington, D.C., who studied the problem while was an undergraduate at Williams College in Williamstown, Mass. It’d be faster, he reasons, to veer right from the beginning, running directly from the batter’s box to the widest portion of the curve. Of course, a runner is best off running straight toward first base until he’s certain he’s hit more than a single. But Carozza noticed that even when the ball heads straight for a pocket between fielders, making a double almost certain, runners almost never curve out right away.”

One of Carozza’s colleagues, Stewart Johnson, optimised the path by computer (coming up with that diagram).

“The result was surprisingly close to a circle, both in its shape and its speed: It swung nearly as wide and was only 6 percent faster than Carozza’s circle. On this path, a runner would start running 25 degrees to the right of the baseline — toward the dugout rather than toward first base — and then swing wide around second and third base before running nearly straight to home. Johnson also computed the best path for a double, and it swings nearly as wide, venturing 14 feet from the baseline.”

Free Kick Physics

Roberto Carlos, a Brazillian defender famous for belting free kicks with incredible control (as opposed to Beckham who tended to go for placement over power), hit a pretty memorable free kick against France in the 1998 World Cup. The video is below.

The kick seems to defy the laws of physics. So some scientists have built an equation to explain it. Their work has just been published.

“We discuss the trajectory of a fast revolving solid ball moving in a fluid of comparable density. As the ball slows down owing to drag, its trajectory follows an exponential spiral as long as the rotation speed remains constant: at the characteristic distance where the ball speed is significantly affected by the drag, the bending of the trajectory increases, surprisingly. Later, the rotation speed decreases, which makes the ball follow a second kind of spiral, also described in the paper. Finally, the use of these highly curved trajectories is shown to be relevant to sports.”


Image Credit: Wired Magazine’s story on the study.

The chicken came first

Science has solved the great riddle of poultry origins – in a manner entirely consistent with the notion of an entity creating life (so don’t worry my fundamentalist brethren).

The chicken came first.

“It had long been suspected that the egg came first but now we have the scientific proof that shows that in fact the chicken came first,’ said Dr Colin Freeman, from Sheffield University, who worked with counterparts at Warwick University.

‘The protein had been identified before and it was linked to egg formation but by examining it closely we have been able to see how it controls the process,’ he added.”

Via here.

Social net working: football ratings 2.0

Rating player performance in football (soccer for you Phillistines) games has always been a fairly arbitrary affair. It’s difficult, unless you’re going to count every pass, tackle and off the ball run, to get a fair measure on the contribution of players not directly involved in putting the ball into the back of the net – and what about all those build ups where a striker fails at the last hurdle?

Now, Luís Amaral, a “complex-systems engineer” at Northwestern University in Illinois, has applied social networking styled analysis to the interactions between players that lead up to shots on goal.

An avid soccer fan, Amaral wanted to measure team and player performance in a way that takes into account the complex interactions within the team and each player’s contribution. So he turned to an unlikely source: social networks. Applying the kinds of mathematical techniques used to map Facebook friends and other networks, Amaral and colleagues created software that can trace the ball’s flow from player to player. As the program follows the ball, it assigns points for precise passing and for passes that ultimately lead to a shot at the goal. Whether the shot succeeds doesn’t matter. “There’s lots of luck involved in actually getting it in,” Amaral explains. Only the ball’s flow toward the goal and each player’s role in getting it there factors into the program’s point system, which then calculates a skill index for each team and player.

The results:

When the researchers used the program to analyze data from the 2008 UEFA European Football Championship, the indices closely matched the tournament’s outcome and the overall consensus of sports reporters, coaches, and other experts who weighed in on the performances.

Cool. More info here.

Supersizing the Last Supper

You know that famous painting – the one the Da Vinci code is all about… well, there have actually been a bunch of “last supper” paintings over the years – and it seems Jesus and the 12 (or 11 depending on what time of the evening the painting captures) are eating a little bit more each time.


That’s the subject of a new study of 52 of the paintings, conducted by a pair of American brothers.

Using computer-aided design technology, the pair scanned the main dish, bread and plates and calculated the size of portion relative to the size of the average head in the painting.

Over a thousand years, the size of the main dish progressively grew by 69.2%, plate size by 65.6%and bread size by 23.1%, they found.

The study, published in Britain’s International Journal of Obesity, is co-authored by Mr. Wansink’s brother, Craig, a professor of religious studies at Virginia Wesleyan College in Norfolk, Virginia, and an ordained Presbyterian minister.

How to find the perfect wife

This is a question that needed some science applied to it. It turns out the optimal wife is 27 percent smarter than her husband. IQ tests on the first date probably come on a bit strong – but by the time you reach the altar you need to have established a pecking order. Here’s the science. Here’s the CNET report.

The highlights are, indeed, a joy to behold, squeeze tightly, and never, ever let go. The perfect wife is five years younger than her husband. She is from the same cultural background. And, please stare at this very carefully: she is at least 27 percent smarter than her husband. Yes, 35 percent smarter seems to be tolerable. But 12 percent smarter seems unacceptable. In an ideal world–which is the goal of every scientist–your wife should have a college degree, and you should not. At least that’s what these scientists believe.

I know your bit will already be chomped with your enthusiasm for learning these learned scientists’ methodology. Well, they interviewed 1,074 married and cohabiting couples. And they declared, “To produce our optimization model, we use the assumption of a central ‘agency’ that would coordinate the matching of couples.” Indeed.

Finding that woman might prove difficult. But if you synchronise the science with a separate mathematical model (at the end of this article) you’ll learn that the 38th woman you consider is the one.

If you interview half the potential partners then stop at the next best one – that is, the first one better than the best person you’ve already interviewed – you will marry the very best candidate about 25 per cent of the time. Once again, probability explains why. A quarter of the time, the second best partner will be in the first 50 people and the very best in the second. So 25 per cent of the time, the rule “stop at the next best one” will see you marrying the best candidate. Much of the rest of the time, you will end up marrying the 100th person, who has a 1 in 100 chance of being the worst, but hey, this is probability, not certainty.

You can do even better than 25 per cent, however. John Gilbert and Frederick Mosteller of Harvard University proved that you could raise your odds to 37 per cent by interviewing 37 people then stopping at the next best. The number 37 comes from dividing 100 by e, the base of the natural logarithms, which is roughly equal to 2.72. Gilbert and Mosteller’s law works no matter how many candidates there are – you simply divide the number of options by e. So, for example, suppose you find 50 companies that offer car insurance but you have no idea whether the next quote will be better or worse than the previous one. Should you get a quote from all 50? No, phone up 18 (50 ÷ 2.72) and go with the next quote that beats the first 18.

Peanut Batter

A gentleman in the United States has taken it upon himself to collate the win loss record for Charlie Brown’s baseball team. If you’ve ever read the comics you’d expect it to be pretty bleak. And it is. But not as bleak as it could be – the statistician is only willing to count games where a result was specifically mentioned.

http://www.unknowns.org/comics/cbinspiration.gif

Man pens mathematical theory of singleness, gets girlfriend

You can get a PhD writing about just about anything these days. But applying an obscure mathematical theory about the probability of the existence of alien life to the question of your own singleness would appear to be about the limit. Surely.

But that’s what Peter Backus did. He took the Drake Equation – a mathematical analysis of the chance that alien life exists – to decide that there were only about 26 girls who would make appropriate partners for him in all of the United Kingdom.

The Drake Equation (penned in 1961 by Dr. Frank Drake) says N = R* x Fp x Ne x Fi x Fc x L. I’m not sure what that means, but it found that there could be 10,000 civilizations in our galaxy.

The Backus iteration of the Drake equation had the following findings:

His equation looked at the total number of women in the country, then narrowed it down using relevant factors including the number of women in London; the number of “age-appropriate” women (those aged between 24-34); women with a college degree; and those who Backus would find physically attractive.

In the paper Backus summarized that on a given night out in London there is a 0.0000034 percent chance of meeting a woman that meets his criteria and who is also interested in him. That makes his odds of finding a girlfriend only about 100 times better than finding an alien.

You can read his thesis here (pdf).

In a random turn of events he now has a girlfriend who meets all his criteria.