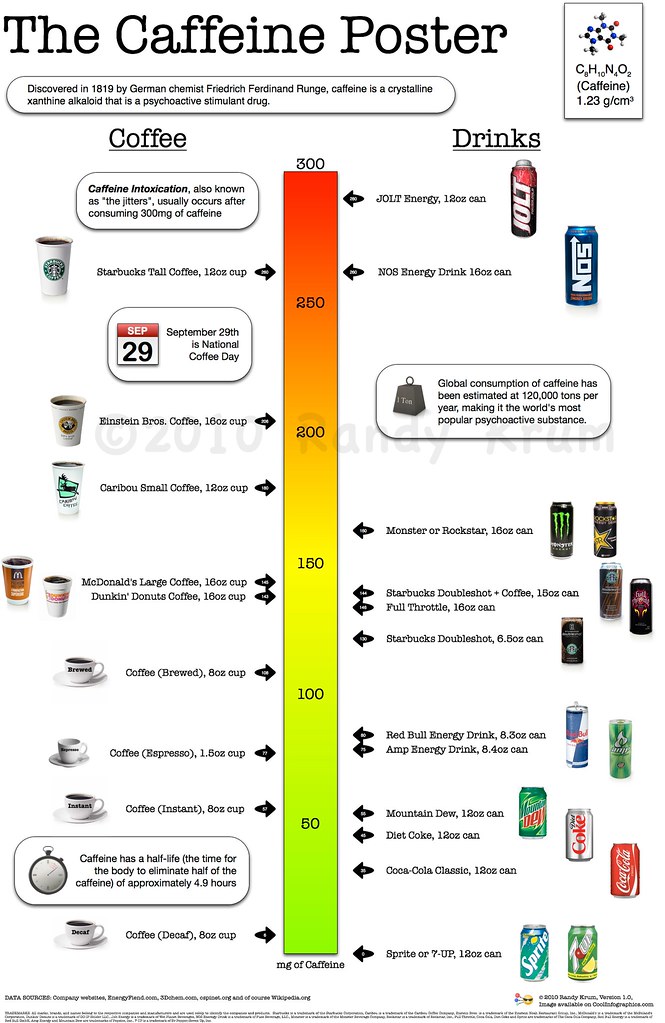
Harvard’s med school put together a bit of an infographic about the health benefits of caffeine. You should totally start drinking it (though there are downsides).


Harvard’s med school put together a bit of an infographic about the health benefits of caffeine. You should totally start drinking it (though there are downsides).


Is your mother on Facebook? Old people are signing up like never before…

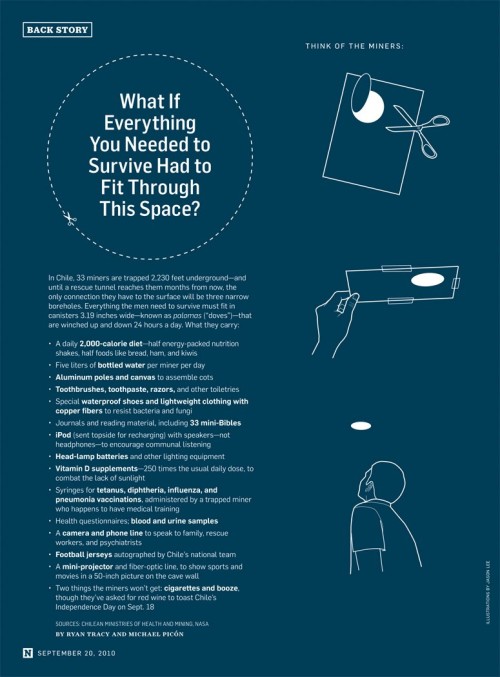
I would hate to be stuck underground not knowing that I was going to be in there for two months. That’s the fate of the miners in Chile. This infographic puts their plight into perspective.

Via The Daily What.
I’m not paranoid about the data Facebook, Google and Apple are gathering about me. Because I put too much stuff out there voluntarily for that to be overly concerning, and I don’t do anything I wouldn’t want the world seeing anyway. But some people find this sort of thing scary.

From here.
Bacon is going to save the day. Again. Muscles had it wrong. Ice-cream has nothing on cured pig.

In full size here at Geekologie.
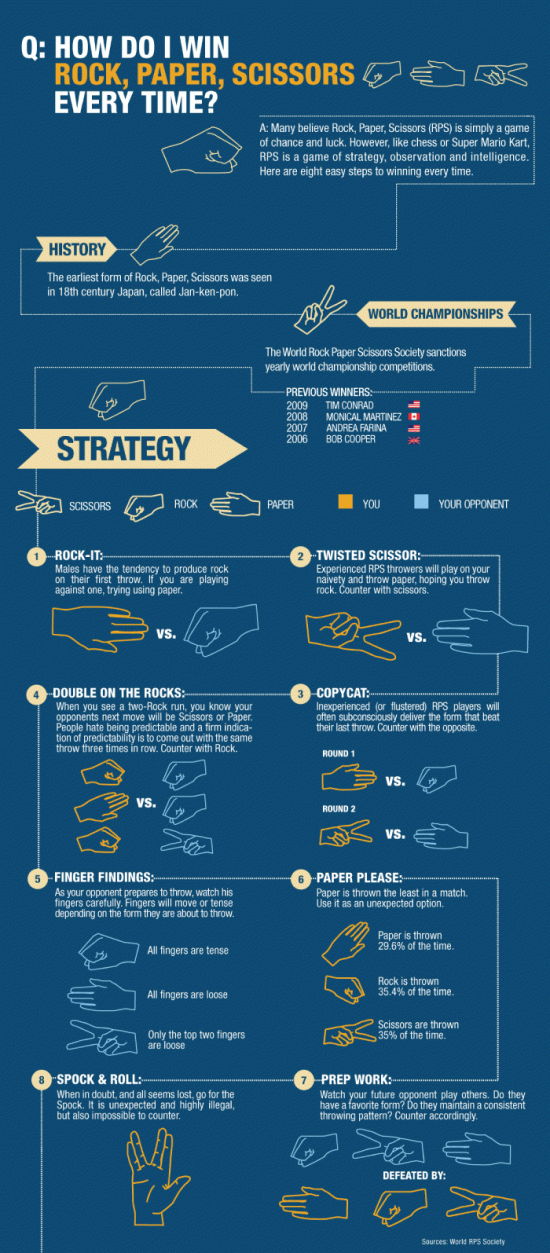
Here’s a handy infographic/tutorial for winning Rock, Paper Scissors against inexperienced or very experienced players.

“Males have a tendency to throw rock on their first try, inexperienced RPS players will subconsciously deliver the item that won previously, and paper is thrown least often, so use it as a surprise.”
Via FlowingData.
I prefer to throw a little psychology into the mix – I just tell the person, honestly, what I’m going to play. And then it becomes a question of trust. Then, sometimes I cheat. Because cheating is the best way to win.
So, you like reading cool stuff on the Internet? Well it turns out most of it still comes from traditional media – so says this infographic from Good, a blog.

Want more zombie movies? Just inspire mass panic by creating a war and Hollywood will acquiesce to your desires.
This graph charts the link.
This article explains the graph.

It is possible to be a geek about so many things. From here.
![[geekmap.png]](http://1.bp.blogspot.com/_NfKwjR8raUA/SxhAY0izYUI/AAAAAAAAAHs/79k3_xw4dHg/s1600/geekmap.png)
It can be confusing having so many Batman franchises to keep abreast with. Here’s a helpful chart via BookofJoe.
The three/ten/180 second rule is hotly debated. Just how long can food sit on the ground before you eat it? According to the doctors it’s not a long time (if you’re worried about bacteria transfering from surface to surface). But who listens to doctors anyway.
Here’s a handy flow chart that’ll help you know when to hold it, know when to fold it, know when to walk away and know when to run. I found it here.

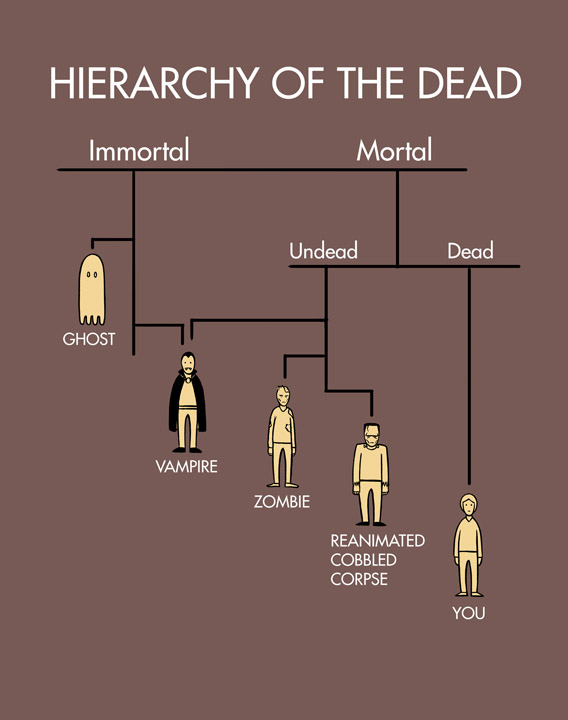
Just in case you were wondering about the post death pecking order – chances are you’ll (until judgment day at least) be at the bottom.
When I use the word “chances” I don’t mean to suggest that there is any probability of zombies, ghosts, or vampires coming after you. But if you’re writing fiction and want to produce better characters then this will at least help you put things in perspective.

From here.
I have more storage capacity on my keyring than the first five or six computers we owned combined.
Here’s a nice storage infographic from geekologie.

You’ll never catch me drinking decaf. But it’s not because I drink coffee for the caffeine hit. You can get caffeine from so many other places that it’s just not worth the effort of drinking a less than optimal coffee.
If you’ve been reading for a while you would have caught this infographic about how healthy different drinks are for you based on sugar content.
