Here’s a cool infographic. 100 Pixar characters side by side and to scale.

It’s at Flickr and is available in mega size (it’s worth a look). The main characters from each franchise are in yellow.
Here’s a cool infographic. 100 Pixar characters side by side and to scale.
It’s at Flickr and is available in mega size (it’s worth a look). The main characters from each franchise are in yellow.
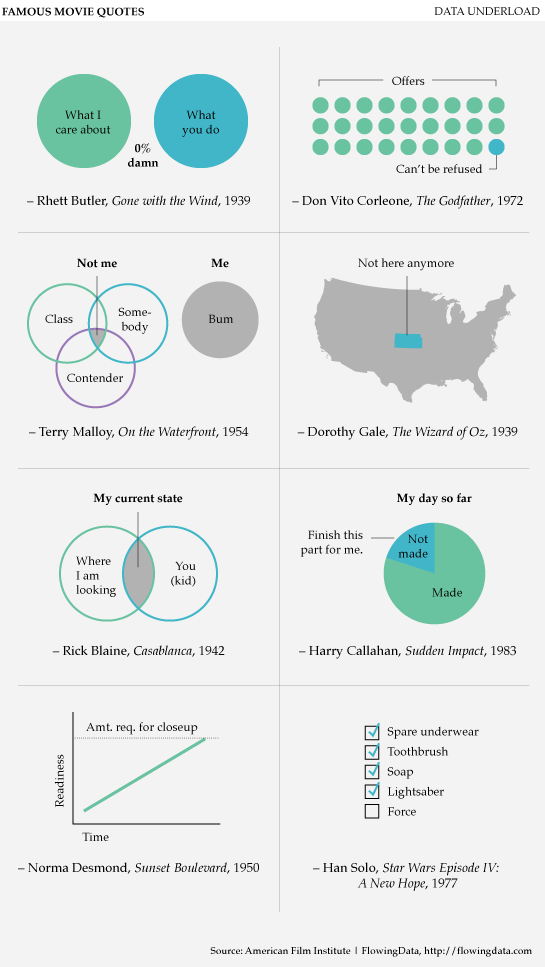
These are cool. From FlowingData.
It’s probably time for the death of the humble phone book. Check out this visualisation (from Flickr) to see why…
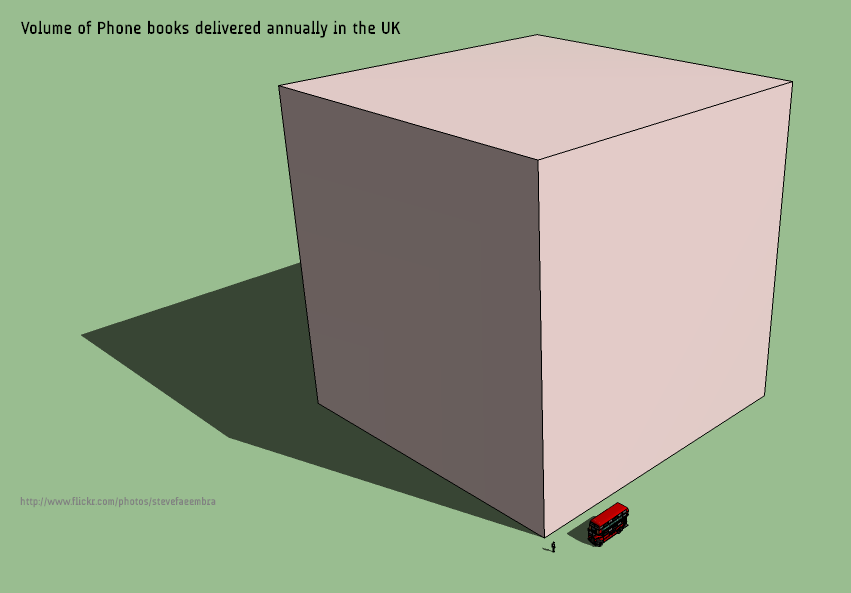
Here are the quite reasonable assumptions on which this graphic was based:
[1] assuming 75,000,000 books delivered (source:www.saynotophonebooks.org)
[2] each is 30cm x 21cm x 4 cm (396.83 per cubic meter). Source: A ruler :)
[3] this gives around 189,000 cubic meters
[4] this is a cube with side 57.38m.
I’ve tracked down the original home of the printed out Wikipedia (or at least what I think is the original post). Turns out it was only the “featured articles” that were printed.
Here’s what it would look like if the whole thing was printed using this criteria…
“If you were to print out the whole thing (not just the featured articles), this is what it would look like based on volumes 25cm high and 5cm thick (some 400 leaves), each page having two columns, each columns having 80 rows, and each row having 50 characters.”

Wikipedia is massive. This massive (according to this visualisation)… this would be a hard copy to carry.

Sugar stacks is a diabetic’s worst nightmare – or indeed a dieter’s worst nightmare – a cubic visualisation of the sugar content of popular American foods and drinks.


