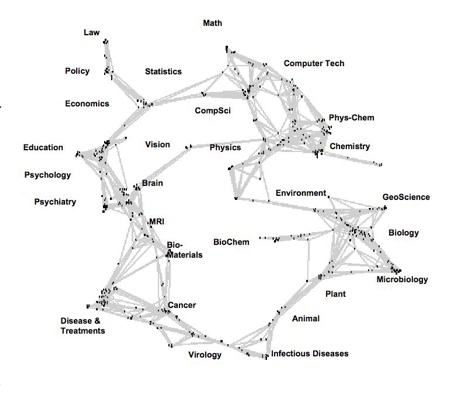
Apparently in the past you could visualise the relationship between different streams of science by tracking the references and citations in scientific journals.
You got something like this:

Now, because most scientific journals are posted online research has been conducted into deeper, broader connections between journals. Using the method described here:
“Over the course of 2007 and 2008, we collected nearly 1 billion user interactions recorded by the scholarly web portals of some of the most significant publishers, aggregators and institutional consortia. The resulting reference data set covers a significant part of world-wide use of scholarly web portals in 2006, and provides a balanced coverage of the humanities, social sciences, and natural sciences.”
It’s only really interesting because it produces a picture like this…
Kevin Kelly simplifies the research methodology into easier to understand terminology.
“Instead of mapping links, this new method maps clicks. The program reads the logs of the servers offering online journals (the most popular way to get articles today) and records the clickstream of a researcher as they hop from one article to the next.”