Tag: mathematics

Just how rich was Scrooge McDuck?

Turns out Scrooge McDuck isn’t just the world’s richest bird. His money piles have been mathematically examined by thebillfold.com to show that he’s about three times richer than the world’s richest man.

When the area under the curve is calculated (from x=-3 to x=5), it yields roughly 46 square inches. The assumption will be made here that one cubic inch is roughly one ounce of gold. To convert that into a dome shape the value is simply cubed, which becomes 97,366 ounces. Given that 1 ounce of gold is roughly $5.00, it can extrapolated that each large pile of gold in the vault is worth $486,830.

However, Scrooge McDuck was first drawn in 1947, therefore inflation must be adjusted for which totals a whopping 5.2 billion dollars per pile. In the picture, there are two smaller piles which roughly equal the larger doubling the total to 10.4 billion. However, the shadows in the corner suggest that the room is a least three times as large as it is. Therefore, Scrooge was privy to a cool 31.2 billion dollars…

Calculating his velocity (roughly 5 m/s2) suggests that this mountain (of which we cannot see the summit) has a slope of 35 degrees, putting a rough estimate of the entire hill at 73.5 billion. Is it possible that McDuck pushed together his wealth to make this monstrosity? In theory, yes, but the eye line of McDuck (fixed at 8 degrees above the horizon relative to the slope) suggests that there are at least two other such mounds, putting his total wealth at over 210 billion, and well beyond the meager 70 billion of richest man in the world Carlos Slim Helu.

Via the Twitters.

Pythagasaurus: The mathematically correct dinosaur

What do you get if you cross Bill Bailey, a short animation, mathematics, and a dinosaur. I’m still not sure. But this made me laugh.

(features a couple of minor rude words)

Just what the doctor ordered: Scientifically accurate fabric brain art

Yes. This is a thing that exists. Thanks to the Museum of Scientifically Accurate Fabric Brain Art, no less. There’s even a wooden counterpart.


If that’s not your cup of tea – how about some mathematically accurate knitting? For example: a double-knitted Möbius-band-into-torus

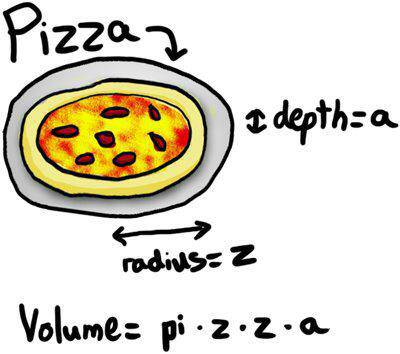
Savour this: Pizza Math is deep…

Unequivocal proof that pizza is both delicious and a learning aid.

Via BoingBoing.

There’s a very similar shirt available on ThinkGeek

It’s π day in 5 days…

The 14th of March (3.14) is pi day. Assuming you write the date like an American. Pi day. It makes the world go around. Pi day has an official website. Where you can get some digits of pi. For fun.

To celebrate the awesome magicalness of Pi. Here are some bits of pi.

This guy used the decimal points of pi to make music.

See more funny videos and funny pictures at CollegeHumor.

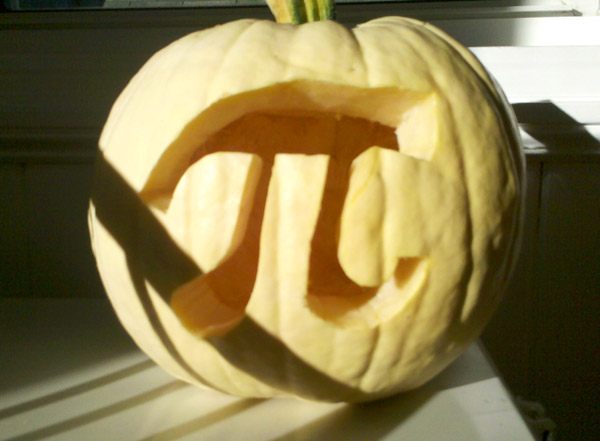
Here’s a pumpkin pi (via BoingBoing).

And a π necklace. Correct to a lot of digits.

How about a π shirt?

Or this one, with almost 4,500 digits of pi.

Get a hold of a pi clock

Or a clock where π features but isn’t central… if you want to display it all year around.

Have some pi drinks. With π ice cubes.

Finally. Check this out. Blow your mind. Eat a pie for pi day – and use pi to help calculate the size of portions required. Because pi is just the other side of pie.

Here are some π posts from my archives.

Mathletes: Reforming sporting endeavours… again

First it was football free kicks and tracking the path of the ball in flight, then it was baseball – and finding the most efficient path around the bases – now mathematicians have turned their attention to basketball. And the free-throw.

You may already have seen this gravity defying shot on YouTube…

8 million people have in a pretty short amount of time. So nailing the perfect free-throw is no doubt something lots of people care about. Not me. I hate basketball. Even though I’m 6’3. I’m rubbish.

It turns out 45 degrees is the perfect angle for a free throw shot. So says this study reported on by the NY Times. Some people probably knew that already. It shouldn’t be too hard to work out. The distance from the line to the hoop is constant. The height of basketball players is a variable, but there’d be a pretty small standard deviation from the average (very tall). This story is actually about a shooting school for basketball players like me. But players who want to spend thousands of dollars being better. It deals with this guy named Andres Sandoval (who is in that photo).

“As the free throw swishes, the building’s silence is broken by a disembodied voice announcing “46.” Another nothing-but-net, another “46.” Sandoval follows with one more 46, a 43 and a 49, all of which reflect the angle of the ball’s arc.

At courtside, the device speaking in a computerized monotone has snapped high-speed digital photographs of Sandoval’s shots and combined them. The composite is displayed on a screen, with color arcs tracking the trajectory of each try. The ideal for a standard player is 45, though Sandoval earns a solid green.

The screen also indicates precisely where the ball, which is a little less than nine and a half inches in diameter, lands inside the rim, which is 18 inches in diameter. The objective is for the center of the ball to hit 8 to 10 inches inside the rim. Sandoval usually settles on 12.”

Sounds good in theorem

Looking for a novel Christmas present? It doesn’t get any more novel than giving somebody their own brand spanking new mathematical theorem. Named in their honour. That’s the service Theory Mine is offering. For just $15 dollars. For the price of five reasonably priced coffees your loved one could be the talk of the mathematical fraternity, that is, if the computer that discovers new theorems can come up with something amazing.

It’s all very simple.

It’s the new thought that counts. Right.

You do the math, you do the monkey math…

Thanks to RodeoClown, in the comments of that last monkey theorem quote, I now know the magnitude of improbability involved in a monkey creating the works of Shakespeare (or, even just one line from Hamlet).

The balance of probability is so incredibly weighted against a monkey even getting the right sequence of letters in order (every time the monkey strikes a letter there are 31 other keys he might press rather than getting the next stroke right that it is only the constraints of logic that mean we can’t call the situation impossible.

Which kind of makes you think. One of the arguments against God is broken down into two similar questions of probability (which seem a bit like a paradox to me) – those suggesting the idea of the God of the Bible occurring is so improbable that it’s impossible are, at the same time, suggesting that the improbability of the universe must, by definition, have occurred given infinite time and space. To me, both seem equally improbable. In any moment prior to the world (as we know it) existing it was much more likely not to start existing than it was to start existing. That little conundrum seems to be pretty easy to resolve to me – if one is true, then both can be true, but if one is false then both must be false. Wouldn’t an infinite universe over infinite time inevitably produce each possible permutation of God until it produced one able to control the parameters? Namely, the infinite space part? I think at this point it’s more logical that something pre-existed the nothing. That skews the probability pretty dramatically. Am I getting something wrong with my logic here? Now that I’ve read the math guy’s answer right to the end I can see that he agrees with me. He also wrote a follow up piece in which he answers my conundrum from the previous post.

“So what happens if you have an infinite number of monkeys typing away? Do we get a script for Hamlet as Mr Adams suggests? Yes, we do! In point of fact, we get every combination of letters possible with the given typewriter, and that in infinite quantities. So not only do we get Hamlet, we get Shakespeare’s complete works, The Hitchhiker’s Guide to the Galaxy, this document, and incomprehensibly vast quantities of random garbage. (Note that this document may also qualify as garbage, but I object to it being described as “random”.) An infinite number of monkeys typing randomly will rapidly produce every possible written work. “

The Math

Each time it presses a key, there is a one in 32 chance that it will be correct. To get our little snippet of Hamlet, it will need a total of 41 consecutive “correct” keystrokes. This means that the chances are one in 32 to the power of 41. Let’s look at a table of values.

Keys Chances (one in…)
————————————
1 32
2 32*32 = 1024
3 32*32*32 = 32768
4 32*32*32*32 = 1048576
5 32^5 = 33554432
6 32^6 = 1073741824
7 32^7 = 34359738368
8 32^8 = 1099511627776
9 32^9 = 3.518437208883e+013
10 32^10 = 1.125899906843e+015

20 32^20 = 1.267650600228e+030

30 32^30 = 1.427247692706e+045

41 32^41 = 5.142201741629e+061

204 32^204 = 1.123558209289e+307

The last figure is included only because it is the largest value that the MS Windows calculator can handle — it’s doing better than my hand-held Casio (old faithful!) which only goes up to 1e+99. Okay, so these figures are pretty vast, but we have a lot of monkeys and they can type fast. So how long will it take, on average, for one of my monkeys to type a line matching that sentence? Hard question. Let’s get an idea of how long we are talking here. How many lines can my monkey type in a year, given that it types at a rate of one line per second?

1 line per second
* 60 seconds per minute = 60 lines per minute
* 60 minutes per hour = 3600 lines per hour
* 24 hours per day = 86400 lines per day
* 365.24 days per year = 31556736 lines per year

If you have access to Unix, you can calculate this with the dc command, but be warned that it may take quite a while to calculate and annoy other users because the computer is so slow. Use of the nice command is suggested. The syntax, should you care to try, is as follows. Type the dc command, then type the following lines.

99k
1 1 32 41 ^ / – 60 ^ 60 ^ 24 ^ 365 ^
p

The figure that is eventually printed will be the probability (expressed as a value between zero and one) of our monkey not typing our little phrase from Hamlet in the space of one year’s worth of continuous attempts. The answer that it prints looks like this:

0.99999999999999999999999999999999999999999999999999999938
6721844366784484760952487499968756116464000

Notice all the nines? Even to fifty or more significant figures, this reads 100%. Okay, so realistically, there is no way that our monkey can do its job in a year. Maybe we should start talking centuries? Millenia? As I understand it, common scientific wisdom suggests that the universe is about 15 billion years old (although they may have revised their dating since I last heard about it). We can easily extend our current figure of one year to count many years. Our calculator will be much faster if we break the calculation down to powers of two and just use the “square” operation, so let’s choose a nice even power of two like 2^34, which is about 17 billion (17,179,869,184 to be precise). The new figure is:

0.99999999999999999999999999999999999999999998946
3961512816564762914005246488858434168051444149065728

I said science again

I realise that when a Christian starts out a post about flaws in any part of science by saying “I love science” some people see that as analogous to someone preambling the telling of a racist joke with the line “I have a black friend so it’s ok for me to think this is funny.”

I like science – but I think buying into it as a holus-bolus solution to everything is unhelpful. The scientific method involves flawed human agents who sometimes reach dud conclusions. It involves agendas that sometimes make these conclusions commercially biased. I’m not one of those people who think that the word “theory” means that something is a concept or an idea. I’m happy to accept “theories” as “our best understanding of fact”… and I know that the word is used because science has an innate humility that admits its fallibility. These dud conclusions are often ironed out – but it can take longer than it should.

That’s my disclaimer – here are some bits and pieces from two stories I’ve read today…

Science and statistics

It seems one of our fundamental assumptions about science is based on a false premise. The idea that showing a particular result is a rule based on it occuring a “statistically significant” number of times seems to have been based on an arbitrary decision in the field of agriculture in eons past. Picking a null hypothesis and finding an exception is a really fast way to establish theories. It’s just a bit flawed.

ScienceNews reports:

“The “scientific method” of testing hypotheses by statistical analysis stands on a flimsy foundation. Statistical tests are supposed to guide scientists in judging whether an experimental result reflects some real effect or is merely a random fluke, but the standard methods mix mutually inconsistent philosophies and offer no meaningful basis for making such decisions. Even when performed correctly, statistical tests are widely misunderstood and frequently misinterpreted. As a result, countless conclusions in the scientific literature are erroneous, and tests of medical dangers or treatments are often contradictory and confusing.”

Did you know that our scientific approach, which now works on the premise of rejecting a “null hypothesis” based on “statistical significance” came from a guy testing fertiliser? And we now use it everywhere.

The basic idea (if you’re like me and have forgotten everything you learned in chemistry at high school) is that you start by assuming that something has no effect (your null hypothesis) and if you can show that it does more than five percent of the time you conclude that the thing actually does have an effect… because you apply statistics to scientific observation… here’s the story.

While its [“statistical significance”] origins stretch back at least to the 19th century, the modern notion was pioneered by the mathematician Ronald A. Fisher in the 1920s. His original interest was agriculture. He sought a test of whether variation in crop yields was due to some specific intervention (say, fertilizer) or merely reflected random factors beyond experimental control.

Fisher first assumed that fertilizer caused no difference — the “no effect” or “null” hypothesis. He then calculated a number called the P value, the probability that an observed yield in a fertilized field would occur if fertilizer had no real effect. If P is less than .05 — meaning the chance of a fluke is less than 5 percent — the result should be declared “statistically significant,” Fisher arbitrarily declared, and the no effect hypothesis should be rejected, supposedly confirming that fertilizer works.

Fisher’s P value eventually became the ultimate arbiter of credibility for science results of all sorts — whether testing the health effects of pollutants, the curative powers of new drugs or the effect of genes on behavior. In various forms, testing for statistical significance pervades most of scientific and medical research to this day.

A better starting point

Thomas Bayes, a clergyman in the 18th century came up with a better model of hypothesising. It basically involves starting with an educated guess, conducting experiments and your premise as a filter for results. This introduces the murky realm of “subjectivity” into science – so some purists don’t like this.

Bayesians treat probabilities as “degrees of belief” based in part on a personal assessment or subjective decision about what to include in the calculation. That’s a tough placebo to swallow for scientists wedded to the “objective” ideal of standard statistics.

“Subjective prior beliefs are anathema to the frequentist, who relies instead on a series of ad hoc algorithms that maintain the facade of scientific objectivity.”

Luckily for those advocating this Bayesian method it seems, based on separate research, that objectivity is impossible.

Doing science on science

Objectivity is particularly difficult to attain because scientists are apparently prone to rejecting findings that don’t fit with their hypothetical expectations.

Kevin Dunbar is a scientist researcher (a researcher who studies scientists) – he has spent a significant amount of time studying the practices of scientists, having been given full access to teams from four laboratories. He read grant submissions, reports, and notebooks, he spoke to scientists, sat in on meetings, eavesdropped… his research was exhaustive.

These were some of his findings (as reported in a Wired story on the “neuroscience of screwing up”):

“Although the researchers were mostly using established techniques, more than 50 percent of their data was unexpected. (In some labs, the figure exceeded 75 percent.) “The scientists had these elaborate theories about what was supposed to happen,” Dunbar says. “But the results kept contradicting their theories. It wasn’t uncommon for someone to spend a month on a project and then just discard all their data because the data didn’t make sense.””

It seems the Bayseian model has been taken slightly too far…

The scientific process, after all, is supposed to be an orderly pursuit of the truth, full of elegant hypotheses and control variables. Twentieth-century science philosopher Thomas Kuhn, for instance, defined normal science as the kind of research in which “everything but the most esoteric detail of the result is known in advance.”

You’d think that the objective scientists would accept these anomalies and change their theories to match the facts… but the arrogance of humanity creeps in a little at this point… if an anomaly arose consistently the scientists would blame the equipment, they’d look for an excuse, or they’d dump the findings.

Wired explains:

Over the past few decades, psychologists have dismantled the myth of objectivity. The fact is, we carefully edit our reality, searching for evidence that confirms what we already believe. Although we pretend we’re empiricists — our views dictated by nothing but the facts — we’re actually blinkered, especially when it comes to information that contradicts our theories. The problem with science, then, isn’t that most experiments fail — it’s that most failures are ignored.

Dunbar’s research suggested that the solution to this problem comes through a committee approach, rather than through the individual (which I guess is why peer review is where it’s at)…

Dunbar found that most new scientific ideas emerged from lab meetings, those weekly sessions in which people publicly present their data. Interestingly, the most important element of the lab meeting wasn’t the presentation — it was the debate that followed. Dunbar observed that the skeptical (and sometimes heated) questions asked during a group session frequently triggered breakthroughs, as the scientists were forced to reconsider data they’d previously ignored.

What turned out to be so important, of course, was the unexpected result, the experimental error that felt like a failure. The answer had been there all along — it was just obscured by the imperfect theory, rendered invisible by our small-minded brain. It’s not until we talk to a colleague or translate our idea into an analogy that we glimpse the meaning in our mistake.

Fascinating stuff. Make sure you read both stories if you’re into that sort of thing.

How to find the perfect wife

This is a question that needed some science applied to it. It turns out the optimal wife is 27 percent smarter than her husband. IQ tests on the first date probably come on a bit strong – but by the time you reach the altar you need to have established a pecking order. Here’s the science. Here’s the CNET report.

The highlights are, indeed, a joy to behold, squeeze tightly, and never, ever let go. The perfect wife is five years younger than her husband. She is from the same cultural background. And, please stare at this very carefully: she is at least 27 percent smarter than her husband. Yes, 35 percent smarter seems to be tolerable. But 12 percent smarter seems unacceptable. In an ideal world–which is the goal of every scientist–your wife should have a college degree, and you should not. At least that’s what these scientists believe.

I know your bit will already be chomped with your enthusiasm for learning these learned scientists’ methodology. Well, they interviewed 1,074 married and cohabiting couples. And they declared, “To produce our optimization model, we use the assumption of a central ‘agency’ that would coordinate the matching of couples.” Indeed.

Finding that woman might prove difficult. But if you synchronise the science with a separate mathematical model (at the end of this article) you’ll learn that the 38th woman you consider is the one.

If you interview half the potential partners then stop at the next best one – that is, the first one better than the best person you’ve already interviewed – you will marry the very best candidate about 25 per cent of the time. Once again, probability explains why. A quarter of the time, the second best partner will be in the first 50 people and the very best in the second. So 25 per cent of the time, the rule “stop at the next best one” will see you marrying the best candidate. Much of the rest of the time, you will end up marrying the 100th person, who has a 1 in 100 chance of being the worst, but hey, this is probability, not certainty.

You can do even better than 25 per cent, however. John Gilbert and Frederick Mosteller of Harvard University proved that you could raise your odds to 37 per cent by interviewing 37 people then stopping at the next best. The number 37 comes from dividing 100 by e, the base of the natural logarithms, which is roughly equal to 2.72. Gilbert and Mosteller’s law works no matter how many candidates there are – you simply divide the number of options by e. So, for example, suppose you find 50 companies that offer car insurance but you have no idea whether the next quote will be better or worse than the previous one. Should you get a quote from all 50? No, phone up 18 (50 ÷ 2.72) and go with the next quote that beats the first 18.

Natural functions

Maths and nature go hand in hand. Pine Cone patterns occur in a Fibonacci sequence. And now it seems that plants grow according to mathematical functions. At least if you’re a mathematically inclined photographer who goes looking for such patterns.

More here.

Man pens mathematical theory of singleness, gets girlfriend

You can get a PhD writing about just about anything these days. But applying an obscure mathematical theory about the probability of the existence of alien life to the question of your own singleness would appear to be about the limit. Surely.

But that’s what Peter Backus did. He took the Drake Equation – a mathematical analysis of the chance that alien life exists – to decide that there were only about 26 girls who would make appropriate partners for him in all of the United Kingdom.

The Drake Equation (penned in 1961 by Dr. Frank Drake) says N = R* x Fp x Ne x Fi x Fc x L. I’m not sure what that means, but it found that there could be 10,000 civilizations in our galaxy.

The Backus iteration of the Drake equation had the following findings:

His equation looked at the total number of women in the country, then narrowed it down using relevant factors including the number of women in London; the number of “age-appropriate” women (those aged between 24-34); women with a college degree; and those who Backus would find physically attractive.

In the paper Backus summarized that on a given night out in London there is a 0.0000034 percent chance of meeting a woman that meets his criteria and who is also interested in him. That makes his odds of finding a girlfriend only about 100 times better than finding an alien.

You can read his thesis here (pdf).

In a random turn of events he now has a girlfriend who meets all his criteria.

Cutting a pizza – it’s easy as pi

A bunch of mathematicians (no doubt uni students) have attempted to solve the dilemma of distributing pizza slices evenly to people who have made equal contributions to the pizza buying cause. This article explains.

The problem that bothered them was this. Suppose the harried waiter cuts the pizza off-centre, but with all the edge-to-edge cuts crossing at a single point, and with the same angle between adjacent cuts. The off-centre cuts mean the slices will not all be the same size, so if two people take turns to take neighbouring slices, will they get equal shares by the time they have gone right round the pizza – and if not, who will get more?

It’s complex. Apparently. If you have two diners, and the pizza is cut an even number of times, the trick is to take alternate pieces.

It has been known since the 1960s that when N is even and greater than 2, an answer to the first question is for Gray and White to choose alternate slices about the point P of concurrency.

The conclusion – from the paper that’ll cost you $20 to buy – was this:

It was conjectured by Stan Wagon and others, that for N=3,7,11,15,…, whoever gets the center gets the most pizza, while for N=5,9,13,17,…, whoever gets the center gets the least. We prove this Pizza Conjecture by first showing its equivalence to a (pretty wild) trigonometric inequality. This inequality is proved with the aid of a theorem that counts lattice paths. Our main theorem is sufficiently general that, as a bonus, results concerning the equiangular slicing of other dishes are obtained.

One can only assume all this would be easier with one of these plates.

Become a mathlete, impress nobody

I don’t want to pretend to be all that interested in maths. I’m not. But I am interested in party tricks. Especially party tricks that make me look smart.

Here’s Wired’s collection of mathematics hacks to impress your friends (except the friends of yours who have maths degrees who don’t like jokes about e^x. That’s you Benny. Dan has a maths degree and he liked my jokes…

“To multiply, say, 11 x 32, add the digits of 32 (3 + 2 = 5) and insert the sum between them: 352. Numbers with two-digit sums use a slight variation: For 11 x 84 (8 + 4 = 12), add the 1 from 12 to the 8 and leave the 2 in the middle: 924. “

The stupidity of infinity

Mathematicians like to ponder infinity. I think this is particularly stupid when it comes to fractions.

I heard some maths person on the ABC talking about how there’s an infinite number of numbers between two integers. That was a bit dumb.

The reason I’m talking about maths at all is because I just read my second favourite maths joke of all time, from Bill Bailey, via Wikipedia

“An infinite number of mathematicians walk into a bar. The first goes up to the bartender and says, “I’ll have a pint of lager, please.” The next one says, “and I’ll have half of what he’s having.” The bartender says, “You’re all idiots,” and pulls two pints.”

And this my friends, is a mathematical limerick.

The solution –

A dozen, a gross, and a score
Plus three times the square root of four
Divided by seven
Plus five times eleven
Is nine squared and not a bit more.

For the record, this is my favourite mathematical joke in condensed format…

An insane mathematician gets on a bus and starts threatening everybody: “I’ll integrate you! I’ll differentiate you!!!” Everybody gets scared and runs away. Only one lady stays. The guy comes up to her and says: “Aren’t you scared, I’ll integrate you, I’ll differentiate you!!!” The lady calmly answers: “No, I am not scared, I am e^x.”

That, and other mathematical jokes, can be found here