Tag: infographics

The Beatles hit the charts

The Beatles are no strangers to the charts – but they are perhaps unfamiliar with online fanboys turning their careers into infographics. Charting the Beatles is a cool, and slightly ambitious project that is producing charts like this one which is based on the fun fact that Beatles songs often contained references to other Beatles songs.

Stuff that happens in one minute

Have you ever wandered away from roasting coffee for just a minute only to look back and see your kitchen filling with putrid smelling smoke that brings about mild symptoms of asthma? No. Well I have. Just now. A lot can happen in a minute (or 6 minutes which truth be told was how long I had left for).

Here are just some of the amazing things that happen in a minute.

Why printers are overrated

I’ve never had a good experience with printers. They never work. They are frustrating. And worst of all… they are expensive. The Oatmeal has an exploration of printer frustration – this is my favourite.

This graph – via Boing Boing Gadgets (and I think originally from Gizmodo) – compares ink prices to other liquids.

Why you shouldn’t drink bottled water afterall

Bottled water is for dummies. Anybody who has held a bottle of Evian up to a mirror knows that. It’s a joke perpetrated and perpetuated on us by the major softdrink labels – for whom it represents a license to print money.

If you buy bottled water (and I do) for any reason other than the fact that it’s a hot day, the water is cold, and softdrink is sugary and bad for your teeth, then you should check out this infographic.

If you live in that Australian town that banned bottled water (or Magnetic Island) then you should read this graph so that you have great statistics to use in your next argument.

Presented by Online Education
The Facts About Bottled Water

Best. Infographic. Ever.

The heading is only true if you’re a teenage boy and obsessed with passing gas and want to know more about your flatulence. I learned new things.

Facts About Your Farts
Source: Online Education

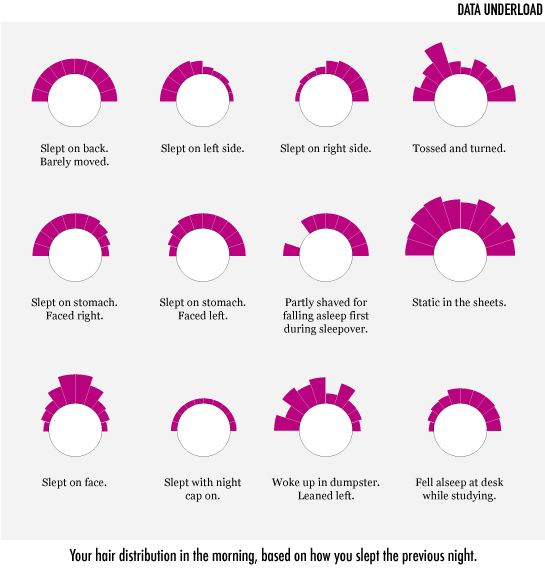
What your bed head says about how you slept

I like this infographic from FlowingData. Click it to see the full size (for those seeing this in the sidebar).

Bed Head Infographic

This post is about a self descriptive graph

XKCD came up with this brilliant graph. I shared it in my Google Reader items the other day. It deserves its own post.

Self-Description

The alt text reads: “The contents of any one panel are dependent on the contents of every panel including itself. The graph of panel dependencies is complete and bidirectional, and each node has a loop. The mouseover text has two hundred and forty-two characters.”

Tangible Twitter

I’m using Twitter again (feel free to follow me). I stopped for a while because I didn’t have the time or patience to bother with it. But now I’ve set up little automated things that import anything I bookmark and everything I post here. And I can post what I’m listening to on iTunes as well. Exciting stuff. I like that I’m contributing to the noise to signal ratio on Twitter (on the noise side of the equation).

But that’s not the reason I’m posting this. The reason I’m posting this is to draw your attention to this infographic that considers the voluminous amount of information currently residing on Twitter’s servers. And imagining what would happen if you turned it into paper. This was put together by GOOD.is. They make good infographics.
if-you-printed-twitter

Crayola’s Law

Where do they get the colours from? Who knows. But since the history of crayons Crayola’s colour range has doubled every 28 years.

Image via weathersealed.com

From here, via here.

How restaurant menus work

Ever wondered why you go to a restaurant and end up ordering the dish that’s not the most expensive on the menu but is certainly not the cheapest. Here’s the answer.

2. The Anchor The main role of that $115 platter—the only three-digit thing on the menu—is to make everything else near it look like a relative bargain, Poundstone says.

Via CafeDave.

106 billion snowflakes

Chuck Palahniuk may have been a bit of a nihilistic fatalist when penning this line in Fight Club.

You are not a beautiful and unique snowflake. You are the same decaying organic matter as everyone else, and we are all part of the same compost pile.

But he’s right. In a way.

Have you ever wondered how many people have ever lived on earth?

I have.

The modeling here is interesting. And here’s an infographic from Flickr that seems to be based on the same research.

This means, as the Whitlams famously suggested, that if someone is one in a million there aren’t just five more in New South Wales – there are in fact 106,000 people just like them who have lived throughout history.

How zombies work

In the latest bit of cool, but mostly frivolous, science – a Harvard Psychiatrist has explained how zombies work. Now we’ve got mathematical modeling of the zombie outbreak and an understanding of their headspace.

The Frontal Lobe

This part of the brain is involved with “executive functioning” – enabling us to think carefully and solve problems in an abstract way. Clearly, there’s not much going on there if you have the misfortune of being afflicted with living deadness. But we do know that zombies can see us and sense us. Schlozman concludes that zombies possess just enough frontal lobe activity to “listen” to the thalamus, through which sensory input is processed.

But the frontal lobe function most relevant to understanding zombie behavior is the control of “impulsivity”-the general term for when you do something and, if you had two more seconds, you might not have done it. For instance, if in a fit of rage you have the sudden urge to punch your boss in the face, the frontal lobe intervenes and allows you to consider why that might be a bad idea.

The Oatmeal has a nice graphical warning about the coming zombie apocalypse. It’ll be eye-opening. But it might contain some words you’ll find offensive – so be warned.

Coffee infographic

The same group that brought us the awesome apostrophe flow chart has produced arguably the best infographic ever made.

It’s so good I’m posting the whole thing.

A weak title

Knowing the right button to push is half the battle. This handy chart helps you tackle everybody from Achilles to Satan.

It will be on sale as a poster somewhere, sometime. It’s from here.

Winefographic

Ever wondered how Australia stacks up as a consumer of wine – we all know Australia produces good stuff… Here’s an infographic.

There’s a “key” of sorts with the comparison between Luxembourg and Brazil. It’s calculated per capita.